How do we analyze evaluation data?
Without going into complicated data-analysis techniques, calculation of percentages and means (or averages) can be used in most instances to analyze and summarize quantitative data. Microsoft Excel or similar spreadsheet programs can be used to summarize data and conduct computations. Even if the educator is not familiar with data-analysis software, the steps shown in the following example can be used to analyze and summarize data of financial education programs. To present data in a clear and understandable manner, it is useful to use tables, bar charts, pie charts, line graphs or other types of data-visualization techniques.
Analyzing and Summarizing Quantitative Data
Mean of responses
The mean (average) is calculated by adding or summing all the participants' ratings and dividing the total by the number of respondents (participants who complete data collection). For example, if the total of the ratings is T and the number of participants is N, then the mean (M) can be expressed as T divided by N. Like the example below, you can calculate the pre-test mean and the post-test mean and compare these two values to see if the average scores have improved. If necessary, there are statistical techniques (e.g., mean difference tests) that can be used to make a determination about whether the difference in the means is statistically significant (inferential statistics).
M = Total of Responses (T; Sum)/Total Number of Responses (N; sample size)
For Example (see data in table below):
Pre-Test Mean: 691 (sum of score) / 10 participants = 69.1 points of out 100
Post-Test Mean: 886 (sum of score) / 10 participants = 88.6 points of out 100
| Participant |
Knowledge Pre-Test (X) (100 points) |
Knowledge Post-Test (Y) (100 points) |
Change in Knowledge (Y subtract X) |
Change in Responses |
| A |
65 |
85 |
+20 points |
Improved |
| B |
67 |
98 |
+31 points |
Improved |
| C |
78 |
78 |
0 points |
No change |
| D |
76 |
65 |
-11 points |
Decline |
| E |
60 |
100 |
+40 points |
Improved |
| F |
70 |
90 |
+20 points |
Improved |
| G |
60 |
85 |
+25 points |
Improved |
| H |
55 |
95 |
+40 points |
Improved |
| I |
90 |
90 |
0 points |
Decline |
| J |
70 |
100 |
+30 points |
Improved |
| Notes |
Sum of scores = 691
Number of participants = 10 |
Sum of scores = 886
Number of participants = 10 |
Seven participants improved their scores (out of 10 participants) |
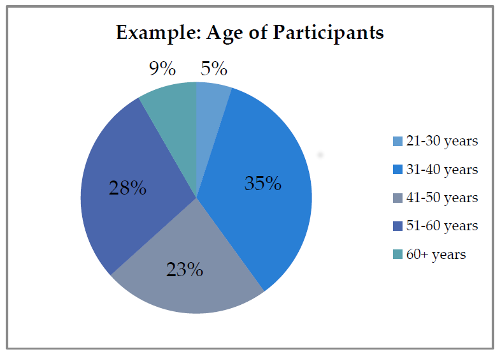
Percent of Responses
Percentages can be used to express the share of participants selecting specific responses to survey items. Percentages are particularly useful for categorical data, such as demographic data, because means values do not make intuitive sense. Percentages and means can be used to summarize data such as age, income and so on. Examples of categorical responses include: gender (male/female), ethnicity (e.g., Hispanic, Caucasian, African-American), age ranges, receipt of high school diploma, etc.
Change in Responses
(Improve, no change, or decline). For longitudinal data, or data that is collected over time, you may want to explore how the responses or data changes over time. For example, if the evaluation collects pre-test (before the intervention) and post-test (after the intervention) data, the responses from each participant can be matched and you can explore how the overall means change from pre-test to post-test for the matched sample (those who have complete both the pre-test and post-test). You also can calculate the percentage of the participants who improved their knowledge and confidence. There is no standard for how many people need to improve or how large of an improvement is needed to establish success or effectiveness of the intervention. Typically, these determinations are context-specific and can be derived from standards in published research/evaluation of similar programs.
For Example (See data in table above):
Number of participants who improved their knowledge: 7 out of 10 participants = 70 percent of participants improved their knowledge from before the intervention (pre-test) to after the intervention (post-test).
Inferential Statistics
Advanced statistical techniques can be employed to further answer the evaluation questions by examining statistical differences between groups, confirming relationships between variables, or generalizing findings to a larger population. These advanced statistics are called inferential statistics. Summarizing the great amount of information about inferential statistics is outside of the scope of this manual. Educators seeking to make statements about the “statistical significance” of their evaluation findings or make comparisons between treatment groups and control or comparison groups should seek out external evaluation assistance or learn relevant information about the appropriate statistical techniques from other sources.
Analyzing and Summarizing Qualitative Data
Qualitative data includes participants' responses to open-ended questions, success stories and observations made by participants. There are computer programs to formally analyze qualitative data (e.g., ATLAS.ti, NVivo), but a detailed description of these computer programs is outside of the scope of this manual. However, the following steps can be used to complete a simple analysis and summary of most of the qualitative data gathered during evaluations.
- Type the question and each of the responses to the question in bulleted form.
- Review all the responses and group them into broad categories based on the content or the underlying message of the response.
- Identify each of the categories based on the underlying theme.
- Review all the categories to understand the overall message.
- Order the response categories based on the number of responses to each theme.
- Identify and summarize the most significant themes to be included in the report.
- Select descriptive quotes to describe and illustrate the significant themes.